Statistical Process Control is a form of continuous improvement that is routinely referred to as SPC. SPC is a type of quality control methodology where various aspects within a process are monitored and controlled in order to maintain full potential during the manufacturing processes. Since all processes exhibit different amounts of intrinsic variation, SPC can be used to identify which areas produce excessive amounts of variation which would naturally impede efficiency or produce unwanted results.
Using this method, graphs are charted or plotted featuring specific pre-determined control limits. The limits are frequently based upon the general capability of the processes. Traditionally, products are inspected once the production process has been completed, however, using SPC processes are statistically analyzed and improved before producing a faulty or inadequate product. Using the SPC methodology it is crucial that data be collected, organized, understood, and fully analyzed to create improvement.
History of Statistical Process Control (SPC)
In the early 1920's a man by the name of Walter Shewhart of Bell Telephone Laboratories pioneered the concept of SPC by first developing a control chart. Through trial and error Shewhart continued to improve what is now known as SPC. In 1931, Shewhart authored a book entitled 'Economic Control of Quality of Manufactured Product' which set the stage for the statistical use within processes to enhance product control.
A professional society was formed in 1945 in regards to SPC - The American Society for Quality Control. During this stint of time SPC methods were introduced to the Japanese industry as well.
The Use of Control Charts in SPC

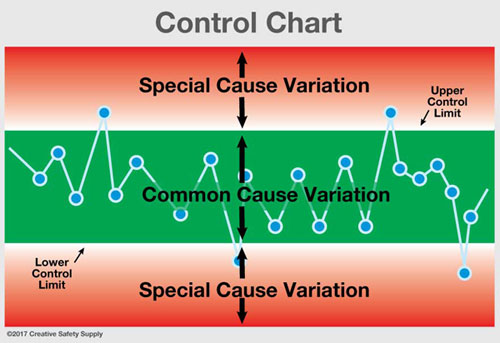
Control charts (also known as Shewhart charts - after Walter Shewhart) are an integral component within the SPC methodology to determine the state of statistic control in either a business or manufacturing process. The main purpose of a control chart is to continuously record data so discrepancies or unusual events can be observed within the typical process performance. There are two separate types of process variation: Common cause variation and Special cause variation.
- Common Cause Variation - These processes produce variations which can be considered 'natural' or 'common' to the process and will nearly always be present. In the statistical world, these processes are 'in control.'
- Special Cause Variation - These types of processes display larger amounts of variation (not present in common cause variation) and often stem from external sources and are considered 'not in control.'
The data from control charts is used in an attempt to locate discrepancies between 'common' and 'special' sources. This is not a one-time observation technique but instead considered more of a long-term, continuous and ongoing monitoring activity.
If there are not any triggers identified within the control chart using the specified detection criteria/rules, then the chart is considered stable. Conversely, if any of the detection rules are triggered, other tools can be utilized to identify the root cause of the unwarranted levels of variation to expose the cause.
The Link between SPC and Continuous Improvement
As the bar gets set higher and higher in the manufacturing sector, the use of continuous improvement strategies such as Kaizen has become absolutely vital in order to maintain high levels of performance and remain competitive in the market. The methodology of SPC goes hand-in-hand with continuous improvement as it can assist in the identification and resolution of anomalies to sustain higher production levels with less defects/waste.
SPC can be considered as a more proactive approach towards continual improvement as the focus remains on the statistical properties of the process versus the end result inspection of a product. The use of SPC can potentially help to ensure quality, maintain profitability, and set the groundwork for future growth.
Resources
- https://www.intouch-quality.com/the-importers-guide-to-managing-product-quality-with-aql-ebook-intouch
- https://asq.org/about-asq/honorary-members/shewhart
Similar Articles
- Quality Control in Manufacturing
- A Brief History of Kaizen: The Key Players
- Control Charts: A Basic Component of Six Sigma
- Quality Control
- What is DFSS (Six Sigma)?
- 5 Lean Principles for Process Improvement
- Toyota Production System (TPS & Lean Manufacturing)
- Kaizen and Lean Manufacturing
- Lean versus Six Sigma: Which is better for your business?


